
Reading search-engine output with AlphaPeptTools#
grassp’s readers for MaxQuant, FragPipe and DIA-NN output (gr.io.read_maxquant,
gr.io.read_fragpipe, gr.io.read_diann) are thin wrappers around
protdata: protdata parses the report into an AnnData, grassp
replaces missing values and transposes it so that proteins are rows and samples are columns.
AlphaPeptTools from the Mann lab is a newer,
scverse-native package that does the same job for a wider range of search engines. Its readers come
from alphabase and are exposed as a single function,
apt.io.read_pg_table, that takes the name of the engine as an argument.
This notebook repeats the data-loading step of the DC tutorial with AlphaPeptTools instead of protdata. It goes through what the reader returns, how it differs from what grassp expects, how to bridge the two in a few lines, and finally checks that the result is identical to the protdata one and runs the remainder of the DC tutorial on it unchanged.
grassp does not wrap this reader. alphabase’s standardized output is designed to be shared across proteomics tools, and the few lines needed to take it into grassp’s layout are shown here in the open, so that what you get is exactly what AlphaPeptTools gives every other scverse package.
Note
AlphaPeptTools is not a grassp dependency. Install it into your environment with
pip install alphapepttools before running this notebook. This notebook was executed with
alphapepttools 0.4.0 and alphabase 1.10.1.
import warnings
from pathlib import Path
from urllib.request import urlretrieve

import numpy as np
import pandas as pd
import anndata as ad
import scanpy as sc
import matplotlib.pyplot as plt

import alphapepttools as apt
import grassp as gr

# Two warnings fire inside alphapepttools and are not actionable here: pandas about mixed column
# types while alphabase loads the table, anndata about turning the integer protein index into strings.
warnings.simplefilter("ignore", pd.errors.DtypeWarning)
warnings.simplefilter("ignore", ad.ImplicitModificationWarning)
Getting the file#
The DC tutorial reads the proteinGroups.txt straight off the URL. protdata accepts a URL because
it hands the path to pandas.read_csv, which downloads on the fly. alphabase sniffs the delimiter from
the file suffix and its first line, so it needs a local path. We download the file once
(about 130 MB) and cache it next to the notebook.
DATA = Path("data")
DATA.mkdir(exist_ok=True)
PG_FILE = DATA / "proteinGroups.txt"
if not PG_FILE.exists():
    urlretrieve(
        "https://public.czbiohub.org/proteinxlocation/internal/proteinGroups.txt", PG_FILE
    )
print(f"{PG_FILE} — {PG_FILE.stat().st_size / 1024**2:.0f} MiB")
data/proteinGroups.txt — 128 MiB
Reading with apt.io.read_pg_table#
One function serves every engine. The search_engine argument picks the alphabase reader; the
measurement_regex argument picks which quantity to read when the report holds several. For
MaxQuant, alphabase ships three named regular expressions, so you can say "lfq" instead of spelling
out the column pattern. The DC tutorial uses LFQ intensities, so that is what we take.
from alphabase.pg_reader import pg_reader_provider

print("Protein-group readers:", apt.io.list_available_reader("pg_reader"))
print("MaxQuant quantities:", pg_reader_provider.get_reader("maxquant").get_preconfigured_regex())
print("MaxQuant default column mapping:", pg_reader_provider.get_reader("maxquant").column_mapping)
Protein-group readers: ['alphadia', 'alphapept', 'diann', 'directlfq', 'fragpipe', 'maxquant', 'mztab', 'proteome_discoverer', 'spectronaut']
MaxQuant quantities: {'raw': '^Intensity(?!\\s[LHM]\\s).+$', 'lfq': '^LFQ intensity(?!\\s[LHM]\\s).+$', 'ibaq': '^iBAQ(?!\\s[LHM]\\s).+$'}
MaxQuant default column mapping: {'proteins': 'Protein names', 'uniprot_ids': 'Protein IDs', 'genes': 'Gene names', 'is_decoy': 'Reverse'}
apt_lfq = apt.io.read_pg_table(PG_FILE, search_engine="maxquant", measurement_regex="lfq")
apt_lfq
AnnData object with n_obs × n_vars = 42 × 10224
    var: 'proteins', 'uniprot_ids', 'genes', 'is_decoy'
What the reader returns, and where it differs from grassp#
Compare this to what gr.io.read_maxquant gave in the DC tutorial. Same file, same 42 samples and
10,224 protein groups, but the object is shaped differently in five ways.
Orientation.
n_obs × n_vars = 42 × 10224: samples are the observations and proteins the variables. That is the scanpy convention (cells × genes) and it is what protdata returns too. grassp works the other way round (proteins × samples), which is whygr.io.read_maxquantends with a transpose.Sample names keep the column prefix.
obs_namesare"LFQ intensity Rep1_01K", not"Rep1_01K". protdata strips the prefix.The protein index is a running integer. alphabase indexes the table by the first mapped column, which for MaxQuant is
Protein names. Those are not unique (many groups have no name), so AlphaPeptTools falls back to0, 1, 2, …and keeps every mapped column invar. The UniProt accessions are invar["uniprot_ids"].Only the mapped metadata survives, under standardized names. protdata carries over all 39 protein-level columns of
proteinGroups.txtunder their MaxQuant names. alphabase keeps the four it knows how to map, renamed to engine-agnostic names (proteins,uniprot_ids,genes,is_decoy). TheReverseflag has already been turned into a boolean.One quantity per read, no layers. The DC tutorial also loaded the
MS/MS countcolumns as a layer.read_pg_tablereturns a single matrix, so a second quantity means a second call.
The intensities themselves are the plain MaxQuant values, with 0 for missing.
print("obs_names:", apt_lfq.obs_names[:3].tolist())
print("var_names:", apt_lfq.var_names[:3].tolist())
print("X dtype:", apt_lfq.X.dtype, "| fraction zero:", f"{(apt_lfq.X == 0).mean():.2f}")
apt_lfq.var.head()
obs_names: ['LFQ intensity Rep1_01K', 'LFQ intensity Rep1_03K', 'LFQ intensity Rep1_05K']
var_names: ['0', '1', '2']
X dtype: int64 | fraction zero: 0.23
| proteins | uniprot_ids | genes | is_decoy | |
|---|---|---|---|---|
| 0 | Peptidyl-prolyl cis-trans isomerase;Peptidyl-p... | P0DN26;A0A075B759;Q9Y536;F5H284 | PPIAL4E;PPIAL4A;PPIAL4D | False |
| 1 | NaN | A0A096LP01 | LINC00493 | False |
| 2 | NaN | P0DPI2;A0A0B4J2D5;P0DPI2-2;A0A0B4J2D5-2 | NaN | False |
| 3 | NaN | A0A0B4J2F0 | PIGBOS1 | False |
| 4 | NaN | A0A0U1RRE5 | NaN | False |
Pulling through more protein metadata#
The DC tutorial removes contaminants using three MaxQuant flags: Only identified by site, Reverse
and Potential contaminant. Only Reverse is in the default mapping. Any further column of the
report can be requested with additional_column_mapping, a dictionary from the name you want in
var to the column header in the file. We also take a few search statistics along so that the
object is not poorer than the protdata one where it matters.
EXTRA_COLUMNS = {
    # the two contaminant flags the DC tutorial needs and alphabase does not map by default
    "only_identified_by_site": "Only identified by site",
    "potential_contaminant": "Potential contaminant",
    # search statistics worth keeping for QC
    "score": "Score",
    "q_value": "Q-value",
    "peptides": "Peptides",
    "razor_unique_peptides": "Razor + unique peptides",
    "sequence_coverage_pct": "Sequence coverage [%]",
    "mol_weight_kda": "Mol. weight [kDa]",
}

apt_lfq = apt.io.read_pg_table(
    PG_FILE,
    search_engine="maxquant",
    measurement_regex="lfq",
    additional_column_mapping=EXTRA_COLUMNS,
)

# The added flag columns arrive as they are in the file: "+" or missing. `Reverse` was mapped to
# `is_decoy` by alphabase and is already boolean.
apt_lfq.var[["is_decoy", "only_identified_by_site", "potential_contaminant"]].apply(
    lambda s: s.value_counts(dropna=False).to_dict()
)
is_decoy                   {False: 10020, True: 204}
only_identified_by_site        {nan: 9768, '+': 456}
potential_contaminant          {nan: 10144, '+': 80}
dtype: object
A second quantity as a layer#
Named regular expressions exist only for the intensity-like columns. Anything else needs an explicit
pattern. The MS/MS count <sample> columns are read the same way; both reads come from the same
table so rows and columns line up, which we check rather than assume.
apt_msms = apt.io.read_pg_table(
    PG_FILE,
    search_engine="maxquant",
    measurement_regex=r"^MS/MS count .+$",
    additional_column_mapping=EXTRA_COLUMNS,
)

lfq_samples = apt_lfq.obs_names.str.removeprefix("LFQ intensity ")
msms_samples = apt_msms.obs_names.str.removeprefix("MS/MS count ")
assert (lfq_samples == msms_samples).all()
assert (apt_lfq.var["uniprot_ids"].values == apt_msms.var["uniprot_ids"].values).all()
print("MS/MS counts:", apt_msms.shape, "| samples and proteins aligned with the LFQ read")
MS/MS counts: (42, 10224) | samples and proteins aligned with the LFQ read
Bringing it into grassp’s shape#
Everything above is mechanical, so we wrap it in one function. It does what
gr.io.read_maxquant does on top of protdata, adjusted for the differences listed earlier:
transpose to proteins × samples,
strip the measurement prefix from the sample names,
index the proteins by UniProt accession (grassp’s marker annotation matches on
obs_names),turn the
"+"-style flags into booleans and record them inuns["RawInfo"]["filter_columns"], which is wheregr.pp.remove_contaminantslooks when called without arguments,attach any further quantities as layers, and store the matrix as
float32like protdata does.
Layer names cannot contain / (h5py reads it as a group separator), hence MS_MS count, the same
name protdata chooses.
def read_maxquant_apt(
    path,
    quantity=("lfq", "LFQ intensity "),
    layers={"MS_MS count": (r"^MS/MS count .+$", "MS/MS count ")},
    additional_column_mapping=EXTRA_COLUMNS,
    index_column="uniprot_ids",
    flag_columns=("is_decoy", "only_identified_by_site", "potential_contaminant"),
):
    '''Read a MaxQuant proteinGroups.txt with alphapepttools into grassp's proteins x samples layout.

    `quantity` and each value of `layers` are (measurement_regex, column_prefix) pairs: the regex
    picks the columns, the prefix is what to strip from them to get the sample name.
    '''

    def _read(regex, prefix):
        a = apt.io.read_pg_table(
            path,
            search_engine="maxquant",
            measurement_regex=regex,
            additional_column_mapping=additional_column_mapping,
        )
        a.obs_names = a.obs_names.str.removeprefix(prefix)
        return a

    main = _read(*quantity)
    adata = ad.AnnData(
        X=main.X.T.astype(np.float32),
        obs=main.var.copy(),
        var=main.obs.copy(),
    )
    adata.obs_names = adata.obs[index_column].astype(str)
    adata.obs_names.name = None

    for name, (regex, prefix) in layers.items():
        layer = _read(regex, prefix)
        assert (layer.obs_names == adata.var_names).all()
        assert (layer.var[index_column].values == adata.obs[index_column].values).all()
        adata.layers[name] = layer.X.T.astype(np.float32)

    # "+" / missing flags to booleans; is_decoy already is one
    for col in flag_columns:
        if adata.obs[col].dtype != bool:
            adata.obs[col] = adata.obs[col].eq("+")
    adata.uns["RawInfo"] = {
        "Search_Engine": "MaxQuant",
        "reader": "alphapepttools",
        "filter_columns": list(flag_columns),
    }
    return adata


dc = read_maxquant_apt(PG_FILE)
dc
AnnData object with n_obs × n_vars = 10224 × 42
    obs: 'proteins', 'uniprot_ids', 'genes', 'is_decoy', 'only_identified_by_site', 'potential_contaminant', 'score', 'q_value', 'peptides', 'razor_unique_peptides', 'sequence_coverage_pct', 'mol_weight_kda'
    uns: 'RawInfo'
    layers: 'MS_MS count'
Is it the same data?#
gr.io.read_maxquant is still available, so we can read the file the protdata way and compare the two
objects directly: intensities, MS/MS counts, protein order and sample order.
dc_protdata = gr.io.read_maxquant(
    PG_FILE, intensity_column_prefixes=["LFQ intensity ", "MS/MS count "]
)

checks = {
    "same proteins, same order": (dc.obs_names == dc_protdata.obs_names).all(),
    "same samples, same order": (dc.var_names == dc_protdata.var_names).all(),
    "LFQ intensities identical": np.array_equal(dc.X, dc_protdata.X),
    "MS/MS counts identical": np.array_equal(dc.layers["MS_MS count"], dc_protdata.layers["MS_MS count"]),
    "decoy flags identical": (dc.obs["is_decoy"] == dc_protdata.obs["Reverse"].eq("+")).all(),
    "contaminant flags identical": (
        dc.obs["potential_contaminant"] == dc_protdata.obs["Potential contaminant"].eq("+")
    ).all(),
}
for name, ok in checks.items():
    print(f"{'✓' if ok else '✗'} {name}")
assert all(checks.values())

print(
    f"\nprotein metadata columns: protdata {dc_protdata.obs.shape[1]}, "
    f"alphapepttools {dc.obs.shape[1]} (the {len(EXTRA_COLUMNS)} requested plus alphabase's 4)"
)
del dc_protdata
✓ same proteins, same order
✓ same samples, same order
✓ LFQ intensities identical
✓ MS/MS counts identical
✓ decoy flags identical
✓ contaminant flags identical

protein metadata columns: protdata 39, alphapepttools 12 (the 8 requested plus alphabase's 4)
The rest of the DC tutorial, unchanged#
From here the object is a grassp object and the DC tutorial applies as written.
The only thing that had to move is the contaminant-filter call: the columns now have alphabase’s
names and are already boolean, and since the reader recorded them in uns["RawInfo"], we can call
remove_contaminants with no arguments at all. Refer to the DC tutorial for the reasoning behind
each step; here we only run them.
# sample metadata from the sample names, exactly as in the DC tutorial
dc.var["subcellular_enrichment"] = dc.var_names.str.split("_").str[-1].str.replace("cyt", "Cyt")
dc.var["biological_replicate"] = dc.var_names.str.split("_").str[0].str[-1]

# published marker sets, matched on the UniProt accessions in obs_names
gr.pp.add_markers(dc, species="hsap")
gr.pp.calculate_qc_metrics(dc)
dc.obs.filter(like="marker_").notna().sum().rename("annotated proteins")
Added marker_lilley annotations for 333/10224 proteins (3.3%)
Added marker_christopher annotations for 658/10224 proteins (6.4%)
Added marker_geladaki annotations for 277/10224 proteins (2.7%)
Added marker_itzhak annotations for 429/10224 proteins (4.2%)
Added marker_villaneuva annotations for 289/10224 proteins (2.8%)
Added marker_hein2025 annotations for 2682/10224 proteins (26.2%)
Added marker_hein2025_gt annotations for 861/10224 proteins (8.4%)
marker_lilley          333
marker_christopher     658
marker_geladaki        277
marker_itzhak          429
marker_villaneuva      289
marker_hein2025       2682
marker_hein2025_gt     861
Name: annotated proteins, dtype: int64
dc_filtered = dc.copy()
print("Protein count before filtering:", dc_filtered.n_obs)

# flags come from uns["RawInfo"]["filter_columns"], written by read_maxquant_apt
gr.pp.remove_contaminants(dc_filtered)
dc_filtered.obs.drop(columns=dc.uns["RawInfo"]["filter_columns"], inplace=True)
print("Protein count after contaminant filtering:", dc_filtered.n_obs)

gr.pp.filter_proteins_per_replicate(
    dc_filtered, grouping_columns="subcellular_enrichment", min_replicates=4, min_samples=2
)
print("Protein count after replicate filtering:", dc_filtered.n_obs)

dc_filtered.layers["raw_intensities"] = dc_filtered.X.copy()
dc_filtered.X = np.log1p(dc_filtered.X)
dc_filtered.layers["log_intensities"] = dc_filtered.X.copy()
gr.pp.impute_gaussian(dc_filtered, distance=1.8)
Protein count before filtering: 10224
Protein count after contaminant filtering: 9605
Protein count after replicate filtering: 8599
dc_filtered_enr = gr.pp.calculate_enrichment_vs_all(
    dc_filtered,
    subcellular_enrichment_column="subcellular_enrichment",
    covariates=["biological_replicate"],
    enrichment_method="lfc",
)
dc_filtered_enr = gr.pp.aggregate_samples(
    dc_filtered_enr, grouping_columns="subcellular_enrichment", agg_func=np.median
)

sc.pp.scale(dc_filtered_enr)
sc.pp.pca(dc_filtered_enr)
sc.pp.neighbors(dc_filtered_enr, use_rep="X", n_neighbors=20)
sc.tl.umap(dc_filtered_enr)
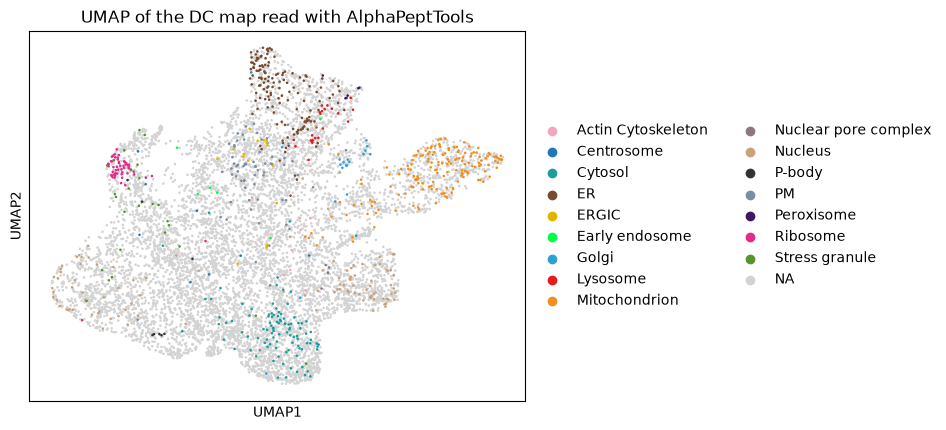
sc.pl.umap(
    dc_filtered_enr,
    color="marker_hein2025_gt",
    title="UMAP of the DC map read with AlphaPeptTools",
)
... storing 'proteins' as categorical
... storing 'genes' as categorical
/Users/mfrank/code/grassp/.venv-dev/lib/python3.12/site-packages/scanpy/plotting/_tools/scatterplots.py:173: PendingDeprecationWarning: The set_bad function will be deprecated in a future version. Use cmap.with_extremes(bad=...) or Colormap(bad=...) instead.
  cmap.set_bad(na_color)
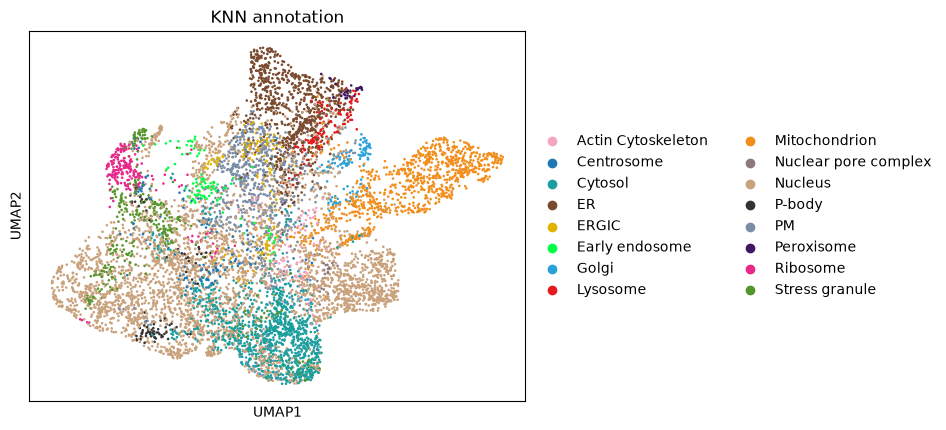
gr.tl.competitive_diffusion(
    dc_filtered_enr, gt_col="marker_hein2025_gt", key_added="competitive_diffusion"
)
sc.pl.umap(dc_filtered_enr, color="competitive_diffusion", title="KNN annotation")
dc_filtered_enr
/Users/mfrank/code/grassp/.venv-dev/lib/python3.12/site-packages/scanpy/plotting/_tools/scatterplots.py:173: PendingDeprecationWarning: The set_bad function will be deprecated in a future version. Use cmap.with_extremes(bad=...) or Colormap(bad=...) instead.
  cmap.set_bad(na_color)
AnnData object with n_obs × n_vars = 8599 × 7
    obs: 'proteins', 'uniprot_ids', 'genes', 'score', 'q_value', 'peptides', 'razor_unique_peptides', 'sequence_coverage_pct', 'mol_weight_kda', 'marker_lilley', 'marker_christopher', 'marker_geladaki', 'marker_itzhak', 'marker_villaneuva', 'marker_hein2025', 'marker_hein2025_gt', 'n_samples_by_intensity', 'mean_intensity', 'log1p_mean_intensity', 'pct_dropout_by_intensity', 'total_intensity', 'log1p_total_intensity', 'n_imputed', 'competitive_diffusion', 'competitive_diffusion_probability'
    var: 'subcellular_enrichment', 'n_merged_samples', 'mean', 'std'
    uns: 'RawInfo', 'marker_lilley_colors', 'marker_christopher_colors', 'marker_geladaki_colors', 'marker_itzhak_colors', 'marker_villaneuva_colors', 'marker_hein2025_colors', 'marker_hein2025_gt_colors', 'pca', 'neighbors', 'umap', 'competitive_diffusion_params', 'competitive_diffusion_colors'
    obsm: 'X_pca', 'X_umap', 'competitive_diffusion_probabilities', 'competitive_diffusion_one_hot_labels'
    varm: 'PCs'
    layers: 'MS_MS count', 'raw_intensities', 'log_intensities', 'original_intensities', 'pvals'
    obsp: 'distances', 'connectivities'
Summary#
AlphaPeptTools reads the DC tutorial’s MaxQuant table into exactly the same numbers as protdata,
and the grassp pipeline runs on the result without modification. What it adds is breadth: one
call signature for nine engines (AlphaDIA, AlphaPept, DIA-NN, directLFQ, FragPipe, MaxQuant, mzTab,
Proteome Discoverer, Spectronaut) where grassp’s protdata wrappers cover three, plus engine-agnostic
column names (uniprot_ids, genes, is_decoy) that make downstream code independent of which
search engine produced the file.
What has to be bridged, and what read_maxquant_apt above does in about twenty lines:
protdata via |
|
|
|---|---|---|
Input |
local path or URL |
local path |
Orientation |
proteins × samples (after grassp’s transpose) |
samples × proteins |
Protein index |
|
integer, accessions in |
Sample names |
prefix stripped |
prefix kept |
Protein metadata |
all 39 columns, MaxQuant names |
4 mapped columns, standardized names; more on request |
Several quantities |
layers in one call |
one call per quantity |
Decoy flag |
|
boolean |
Reader outputs evolve. grassp’s test suite (grassp/tests/test_alphabase_interop.py) checks every
row of this table against the installed alphabase, and that the transformation above still lands
on the protdata result, so the tutorial and the reader do not drift apart unnoticed.